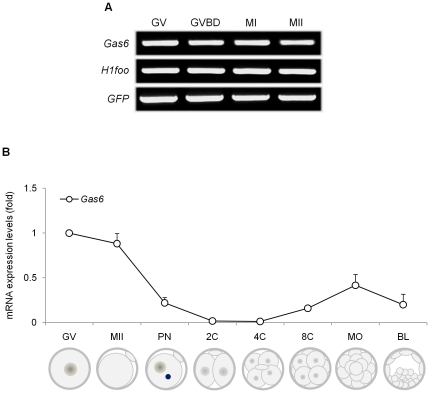
Figure 1. Differential expression of Gas6 during oocyte maturation and early embryogenesis.
(A) Typical pattern of Gas6 expression during oocyte maturation. The mRNA equivalent to a single oocyte taken after culture for 0, 2, 8, and 16 hours, corresponding to GV, GVBD, MI, and MII stages, respectively, was used for each lane. H1foo used as an internal control. GFP was used as an external control to measure equal recovery. (B) Expression of Gas6 during early embryogenesis. Relative gene expression of Gas6 in a single oocyte and single embryo throughout the developmental stages was measured by quantitative real-time PCR. Relative expression levels of Gas6 were calculated from CT values and normalized to added GFP synthetic RNA, and the expression ratio was calculated against Gas6 expression in the GV oocyte. Experiments were repeated at least three times, and data were expressed as mean ± SEM.

