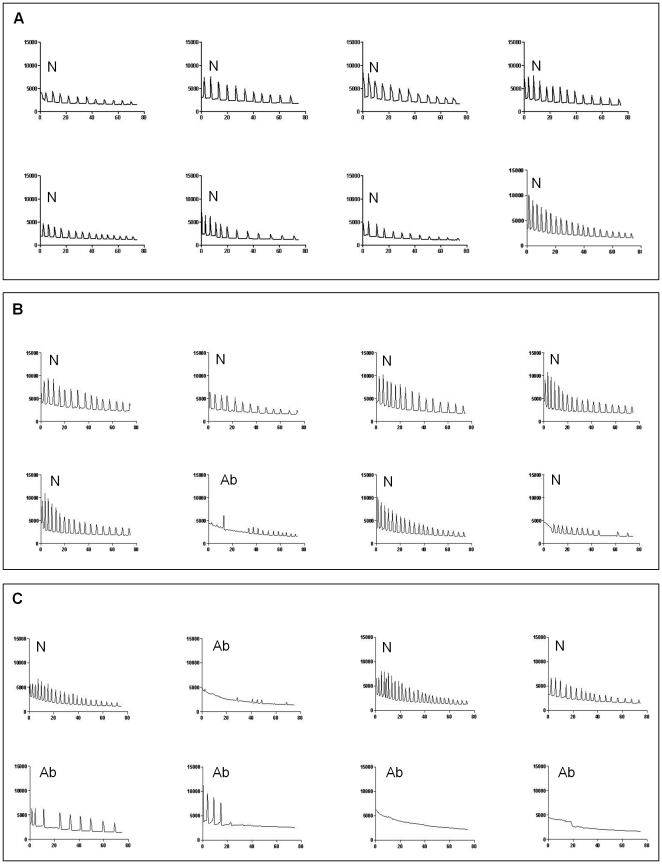
Figure 7. Representative Ca2+ oscillatory patterns in Sr2+-induced MII oocytes.
Changes in the fluorescence of a Ca2+ indicator dye in mouse oocytes followed by incubation in Sr2+-containing medium revealed the almost normal pattern of Ca2+ oscillations in the control (A) and buffer-injected sham control (B) MII oocytes. However, Gas6-silence MII oocytes (C) exhibited both normal and abnormal patterns of Ca2+ oscillations. N, normal Ca2+ oscillatory pattern; Ab, abnormal Ca2+ oscillatory pattern.

