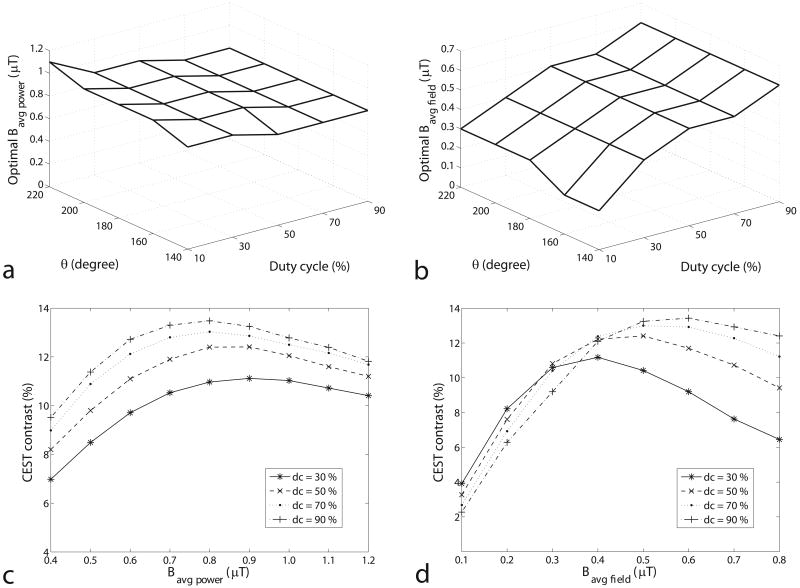
FIG. 1.
The experimental Bavg power (a) and Bavg field (b) that optimize the pulsed CEST contrast as a function of θ and duty cycle in the creatine/agar sample. Note that the optimal Bavg power is relatively independent of θ and duty cycle, while the optimal Bavg field is not. PTR is varied in order to find the optimal Bavg power and Bavg field at each θ and duty cycle. Similar results are found (but not shown) at pH = 6.0 at 9.4 T and pH = 6.4 at 4.7 T and in simulations of this creatine/agar sample and pseudo-phantoms with different frequency offsets (500 Hz to 3000 Hz), exchange rates (50 Hz to 250 Hz), and solute concentrations (0.001 to 0.005). The near independence of the optimal Bavg power on the other acquisition parameters makes Bavg power a more meaningful sequence metric than Bavg field. Figures (c) and (d) plot the CEST contrast as a function of Bavg power and Bavg field, respectively, at θ = 180°. Note the similar dependence on Bavg power at all duty cycles.

