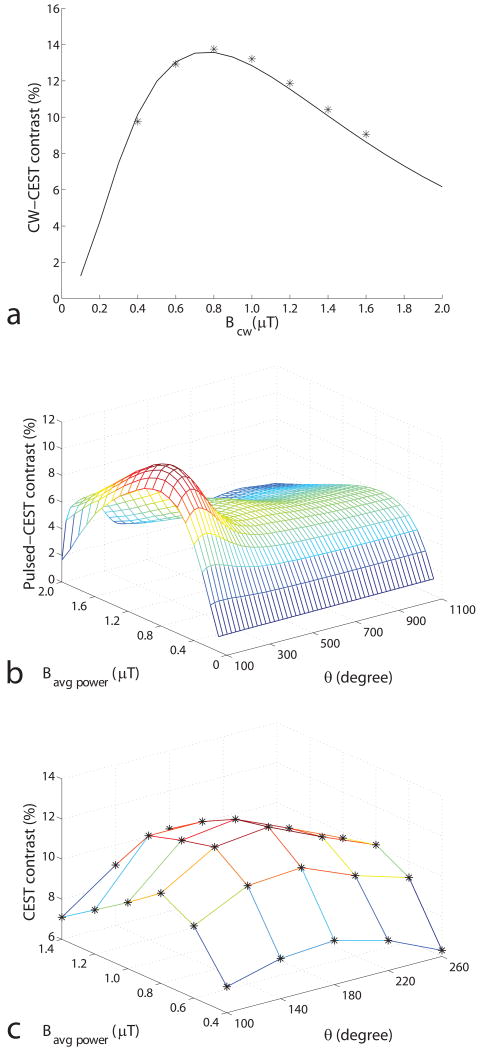
FIG. 2.
a) Simulated and experimental CW-CEST contrast as a function of Bcw. b) Simulated and c) experimental pulsed-CEST contrast as a function of Bavg power and θ at 9.4 T with a duty cycle of 50%. Stars in a) and c) represent the experimental results. (Simulation results calculated using other duty cycles, and for pseudo-samples with varied solute frequency offset, exchange rate, and concentration give similar results, but are not shown here.) The CEST contrast was simulated using a three-pool model. PTR is varied, while duty cycle is maintained at 50%, according to Eq (2). Note in (b) that the optimal Bavg power is independent of θ, and the optimal θ is independent of Bavg power. Optimal Bavg power is largely dictated by direct and macromolecular MT saturation effects, while optimal θ is dictated by solute rotation effects, (additional damped oscillations can be observed at θ ≈ 540°,) as will be discussed in figure 6.

