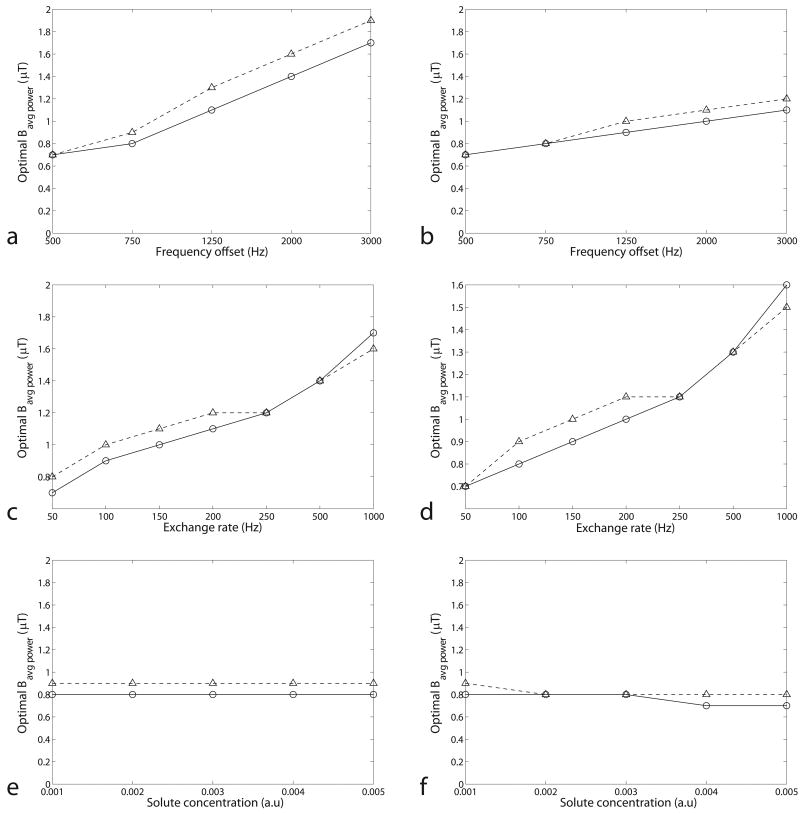
FIG. 3.
Simulated optimal Bavg power at dc = 50% as a function of frequency offset (a), exchange rate (c), and solute concentration (e) in the two-pool model, and frequency offset (b), exchange rate (d), and solute concentration (f) in the three-pool model. Circle and triangle represent CW and pulsed-CEST, respectively. (Remember that in CW-CEST, Bcw = Bavg power.) Note the similar dependence of the optimal Bavg power in CW and pulsed-CEST on the sample parameters. The non-specified sample parameters are from the fitting results of a CW-CEST experiment on a creatine/agar phantom. These results are based on simulations with a Bavg power spacing of 0.1 μT, resulting in discrete jumps.

