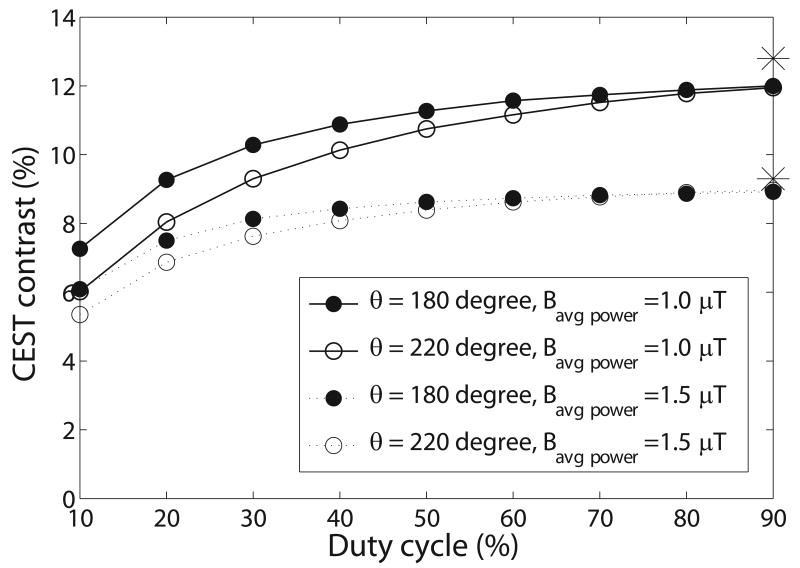
FIG. 5.
Simulated pulsed-CEST contrast as a function of duty cycle using a three-pool model. Each line was calculated using the same Bavg power and θ. The two asterisks on the far right represents the contrast in CW-CEST imaging with a Bcw of 1 μT and 1.5 μT, which deviate from the extrapolations to 100% duty cycle using the same Bavg power due to the effect of the Gaussian pulse shape. Note that the CEST contrast at a duty cycle of 50% is close to the maximum CEST contrast in each line. The parameters used are from the fitting results of the creatine/agar sample. Simulations of pseudo-phantoms with different frequency offsets (500 Hz to 3000 Hz), exchange rates (50 Hz to 1000 Hz), and solute concentrations (0.001 to 0.005) also give the same conclusion.

