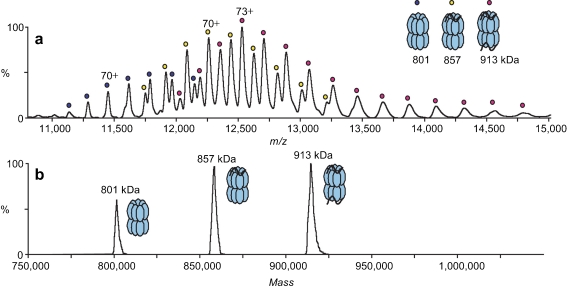
Fig. 2.
Typical native mass spectrometry (MS) results from van Duijn et al. [12] a Nano-electrospray ionization mass spectrum of a mixture of GroEL and unfolded polypeptide gp23 (1:4). Charge-state series of GroEL (800 kDa; blue circles), one gp23 molecule bound to GroEL (856 kDa; yellow circles) and two gp23 molecules bound to GroEL (912 kDa; magenta circles) are seen. b The corresponding deconvoluted spectrum, which reveals the three chaperonin complexes with their binding stoichiometries. (Reprinted from van Duijn et al. [12]. With permission)

