
Fig. 4.
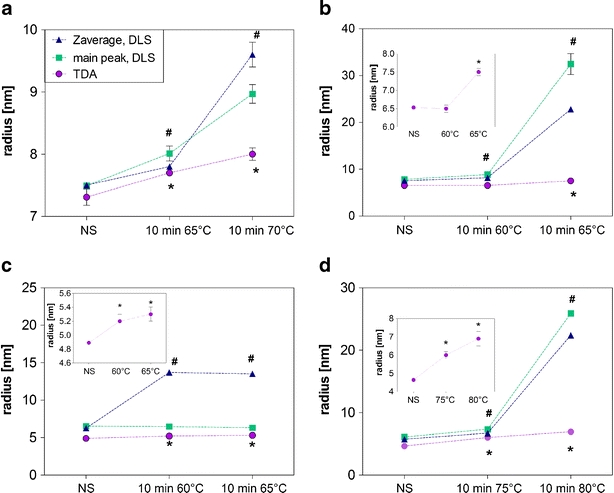
Results for DLS (rZave, rmain peak) and TDA (rh) for non-stressed and aggregated formulations of etanercept (a), adalimumab (b), rituximab (c) and the model IgG (d). *marks rh from TDA, # Zaverage values from DLS, which are significantly higher for the stressed than for the non-stressed formulation (p < 0.05). The results are shown as average ± standard deviation of n = 3 (DLS) and n = 5 (TDA) individual measurements.