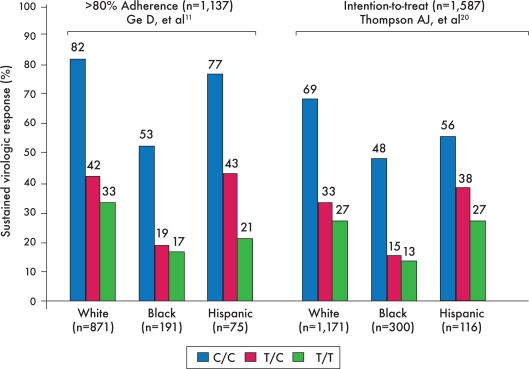
Figure 2.
Sustained virologic response (SVR) rates based on rs12979860 polymorphism genotypes differ across ethnic groups. This graph shows SVR rates for both the adherent and intention-to-treat cohorts of the genome-wide association study that was conducted among patients enrolled in the IDEAL study. The C/C variant was most strongly associated with SVR, independent of ethnicity or adherence.

