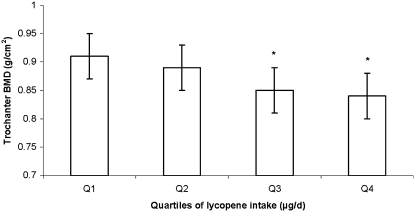
FIGURE 3.
Adjusted mean (±SE) bone mineral density (BMD) at the trochanter (n = 316), by quartile (Q) of lycopene intake in men. The analysis was based on a general linear model, with Dunnett's adjustment for multiple comparisons. P for trend = 0.005 for the trochanter. Significantly different from the lowest tertile: *P < 0.05. The primary predictor was energy-adjusted residuals added to a constant, where the constant equals the nutrient intake for the mean energy intake of the study population. Square root transformation was applied to the nutrient intake before the residuals were created. Models were adjusted for age (y) at exam 20, BMI (in kg/m2), height at exam 1 (inches), total energy intake (MJ/d), physical activity index at exam 20, alcohol intake [none, moderate (<26.4 g alcohol/d for men), or high (≥26.4 g alcohol/d for men)], smoking (never smoked or ever smoked), intake of total calcium (mg/d), intake of total vitamin D (IU/d), intake of caffeine (mg/d), season of BMD measurement, multivitamin use (yes or no), current estrogen use at exam 20 (current compared with former/never user).

