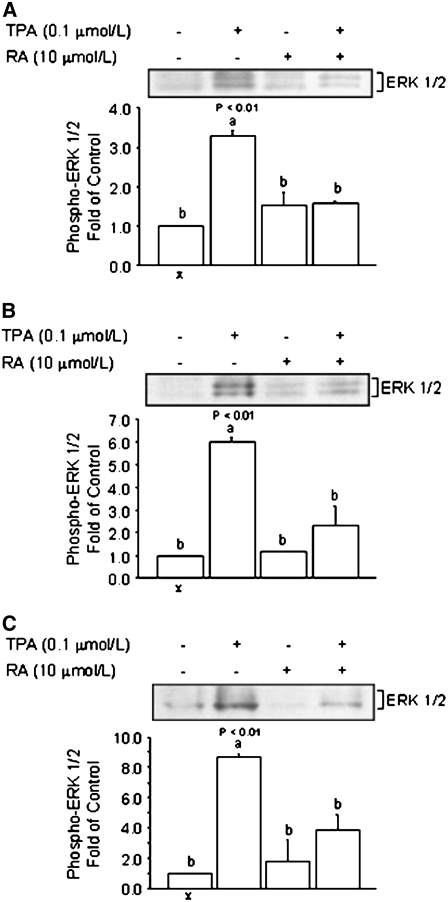
FIGURE 6 .
Comparison of the repressive effects of RA on ERK1/2 activation by TPA in HT-29, MCF-7, and MCF 10A cells. (A) HT-29 colon and (B) MCF-7 breast cancer cells and (C) MCF 10A nonmalignant breast epithelial cells were cultured for 15 min in the presence of TPA (0.1 μmol/L), RA (10 μmol/L), or their combination. Bands represent phosphorylated ERK1/2 and GADPH (loading control). Values are means + SE of triplicates from 2, n = 2, independent experiments. Means without a common letter differ, P < 0.05.

