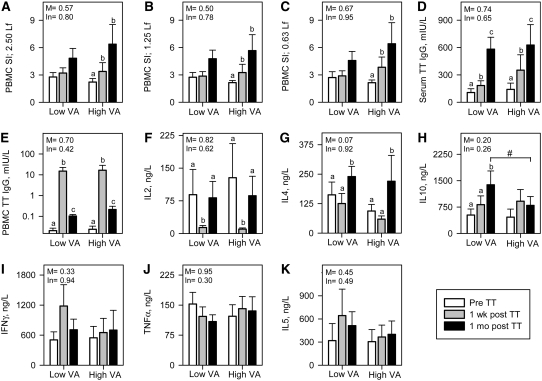
FIGURE 2 .
Immune responses to recall TT vaccination in low VA (n = 18) and high VA (n = 18) groups. (A–C) PBMC SI in 3 different levels of TT antigen. (D) Serum anti-TT IgG responses (E) PBMC-released spontenous anti-TT IgG. (F–K) TT-specific T-cell cytokines in PBMC. Values are means ± SE. Significance levels of the main effects (M) and interactions with time (In) are indicated. Labeled means within a group without a common letter differ, P < 0.05. #Groups differ at that time, P < 0.05.

