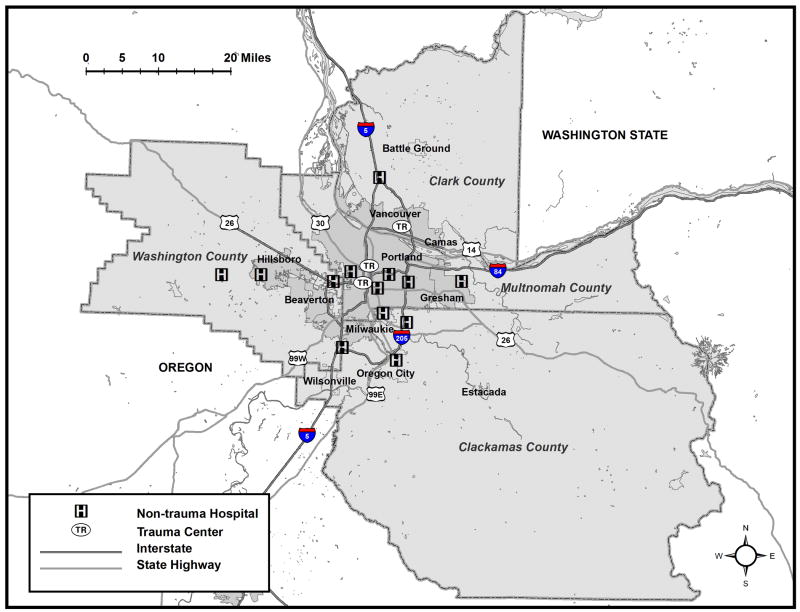
Figure 1. Map of the 4-county study region, including hospitals, trauma centers, major roadways and rivers.
| County | State | Population | Land area (square miles) | Population density (persons per square mile) | % > 65 years | % < 18 years |
| Multnomah | OR | 726,855 | 435 | 1671 | 10.2% | 21.2% |
| Washington | OR | 537,318 | 724 | 742 | 9.5% | 25.6% |
| Clackamas | OR | 386,143 | 1,868 | 207 | 13.1% | 23.3% |
| Clark | WA | 432,002 | 628 | 688 | 11.2% | 26.2% |
| Totals: | - | 2,082,318 | 3,655 | 570 | 10.7% | 23.7% |
*Population demographics are based on 2009 estimates.13 The two trauma centers (TR) in Portland (Multnomah County) are Level I hospitals and the trauma center (TR) in Vancouver (Clark County) is a Level II hospital.

