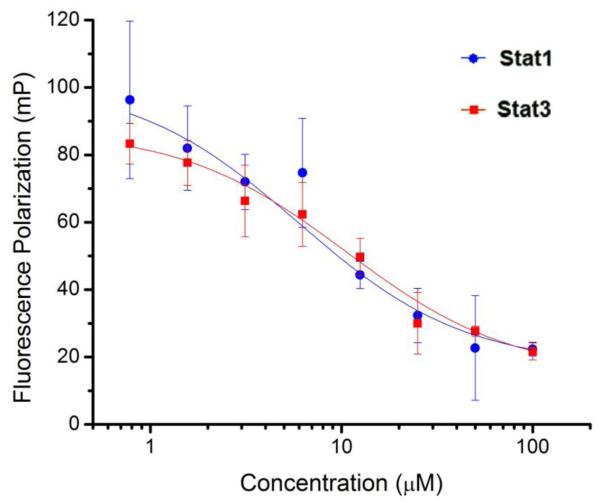
Figure 3.
STAT3 vs. STAT1 binding potency as assessed by FP assays. For STAT3, FP measured upon titrating the F*pYLPQTV (7.2 nM) with compound 14aa in the presence of STAT3 protein (292 nM). For STAT1, FP measured upon titrating the F*GpYDKPHVL-NH2 (10 nM) with compound 14aa in the presence of STAT1 protein (80 nM). STAT5 data not shown.

