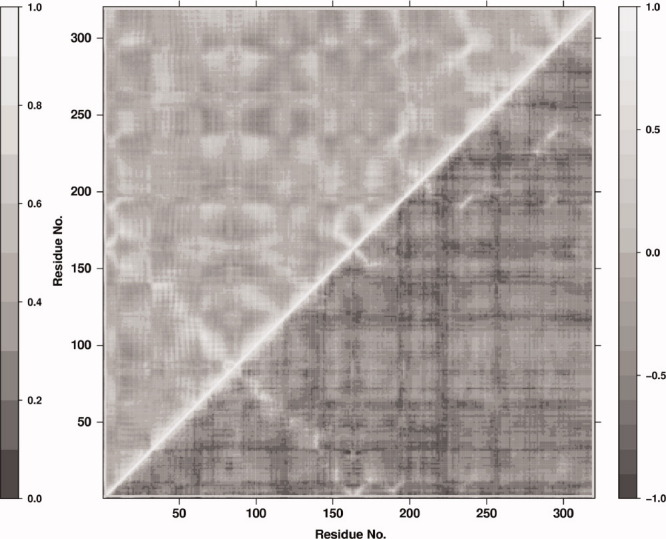
Figure 2.

Cross-correlation matrix of the atomic fluctuations of the Gαi1-subunit Cα-atoms and the geometrical center of GTP. The regions below and above the matrix main diagonal concern the DCC and LMI correlation methods, respectively. DCC correlation values go from −1.0 (fully anti-correlated motions) to 1.0 (fully correlated motions), whereas LMI correlation values go from 0.0 (fully uncorrelated motions) to 1.0 (full correlated motions).
