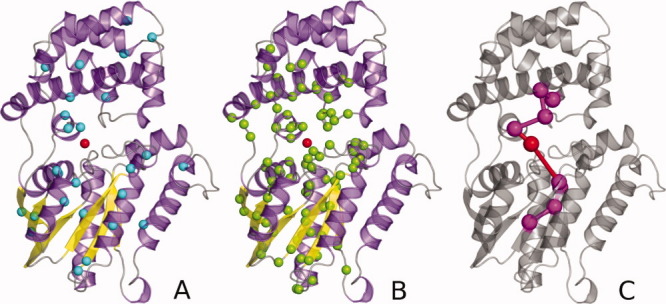
Figure 4.

Results of PSN and PATH analyses on a 10 ns MD trajectory of GTP-bound Gαi1-subunit. (A) Cα-atoms of the 27 stable hub residues, at Imin = 3.0%, are represented as cyan spheres. The GTP molecule, which is a stable hub as well, is shown as a red sphere centered on the C4′ ribose atom. Nodes are considered as stable hubs if they are involved in at least four connectivities at a given Imin (3.0% in this case) in more than 50% of the trajectory frames. (B) The 90 nodes that contribute to the largest cluster at Imin = 3.0% are shown as green spheres centered on the Cα-atoms. The GTP molecule, which participates as well in such cluster, is shown as a red sphere centered on the C4′ ribose atom. (C) Representation of the most frequent shortest communication path (i.e., frequency = 46%). The amino acids that participate in the path are shown as magenta spheres centered on the Cα-atoms, whereas GTP, which participates in the path as well, is shown as a red sphere centered on the C4′ ribose atom. The two apical residues in this path are A152 and I222, located, respectively, in the α-helical and Ras-like domains.
