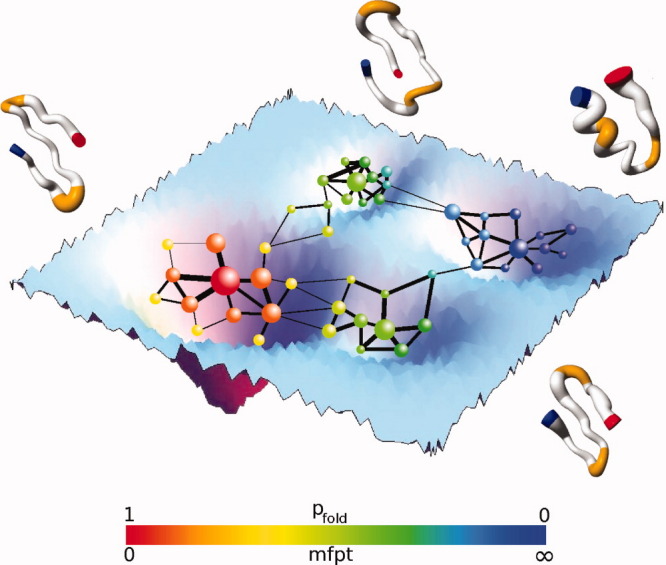
Figure 6.

Network description of MD and evaluation of kinetic distance. The high-dimensional free-energy surface is coarse-grained into nodes of a network. The figure shows a schematic illustration of the transition network of a β-sheet peptide where nodes represent microstates and links represent direct transitions sampled along the MD simulation(s). The size of the nodes and links is proportional to the statistical weight of the microstates and number of transitions, respectively. The cFEP method implemented in Wordom requires a reference microstate. In this simplified illustration, the reference microstate is the large red sphere in the center of the folded state (which is the β-sheet structure, i.e., the basin on the left). The kinetic distance of each node from the reference microstate can be evaluated in Wordom by the folding probability (pfold) or the mean first passage time (mfpt). The kinetic distance is rendered by the continuous coloring from red (folded, i.e., pfold = 1 or mfpt = 0) to blue (unfolded, i.e., pfold = 0 or mfpt = infinity).
