
Figure 2. Factorial association model in the children.
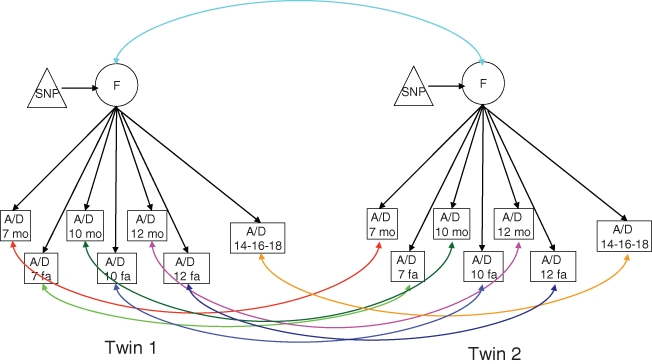
The latent A/D factor loads on the longitudinal A/D measures (3 maternal (mo) and 3 paternal (fa) at age 7, 10 and 12 and one self-report at age 14, 16 or 18), reflecting the stability across time. The effect of the SNP is modeled on the A/D means through the A/D factor. The light blue arrows reflect the twin correlation. The other arrows reflect the twin correlations for the residuals to allow for age-dependent familial effects. The correlations differ for MZ and DZ twin pairs. All estimates are allowed to vary depending on sex. Not shown in the figure (for the sake of clarity), but included in the model: the variance of the A/D factor, which is constrained to 1, the latent residual factors and the effect of age on the mean of the adolescent measure.