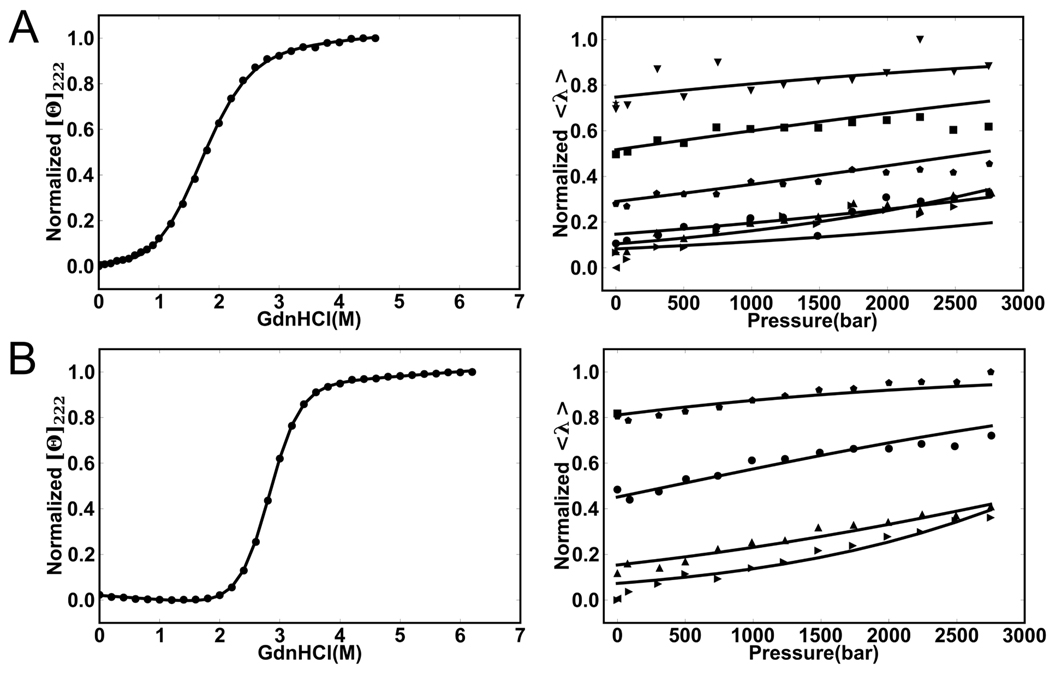
Figure 3.
Results of the equilibrium pressure unfolding of A) NW and B) NWC at multiple GuHCl concentrations. Figures in the left column present the guanidine melts at atmospheric pressure, while those on the right correspond to the pressure profiles. Curves from bottom to top correspond to increasing concentrations of guanidine for A) NW (◀:0.0, ▶:0.5, ▲:1.0, ●:1.5, ⬟:2.0, ■:2.5, ▼:3.0, ⭑:6.0 M GuHCl) and B) NWC (◀:0.0, ▶:1.7, ▲:2.5, ●:3.0, ⬟:3.5, ■:6.0 M GuHCl). Lines through the points correspond to the fits of the data as described in the Supplementary Methods section.

