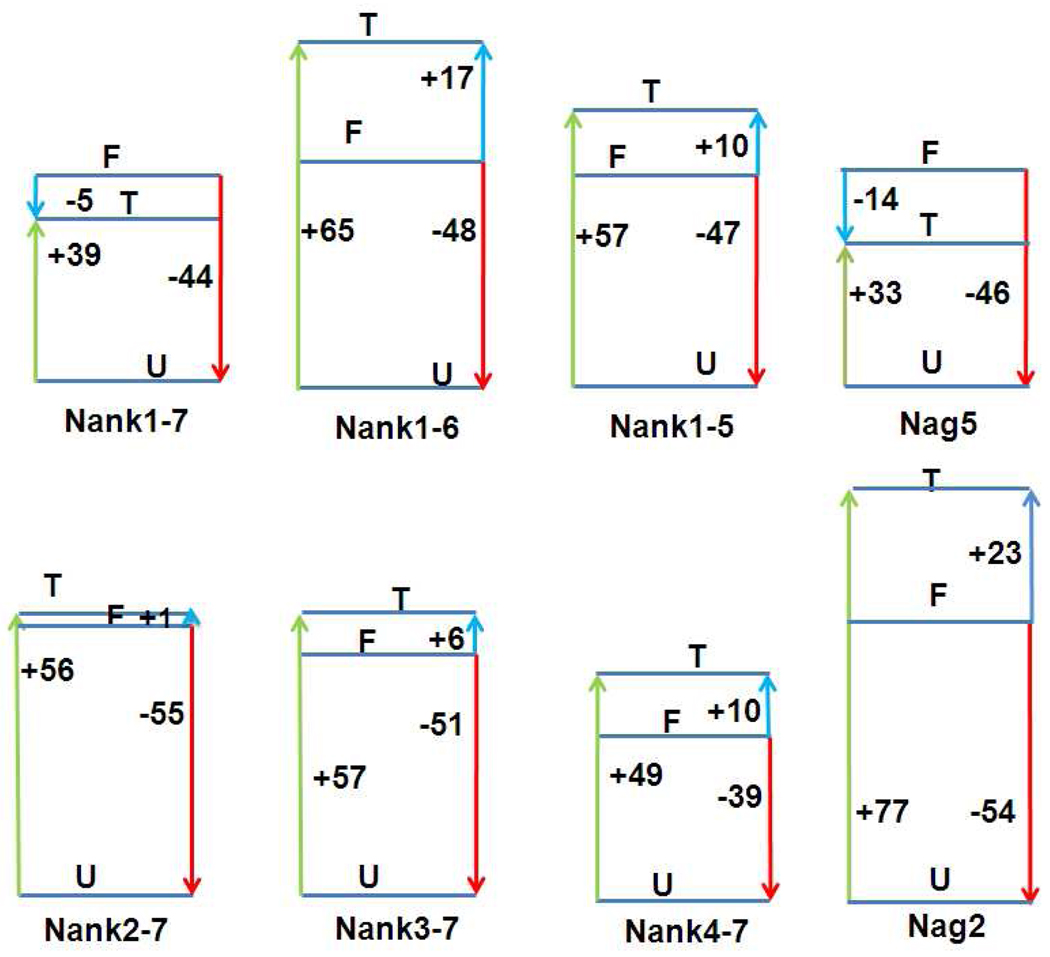
Figure 6.
Volume diagrams for the Nank deletion constructs, as indicated. F, U and T correspond to the folded, unfolded and transition states. Volume values are given in units of ml/mol. Red arrows correspond to the equilibrium unfolding volume, green arrows to the activation volume for the folding transition and blue arrows to the activation volume for the unfolding transition.

