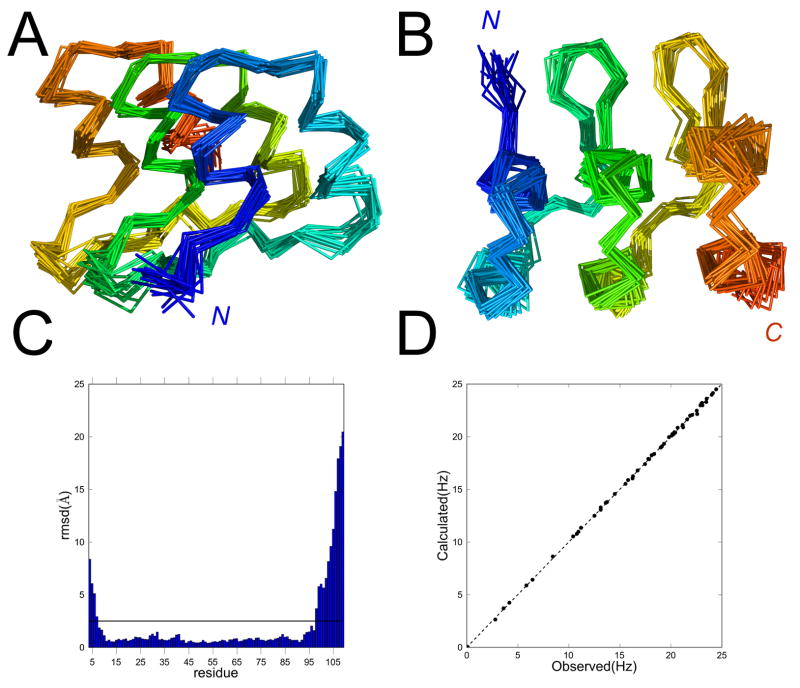
Figure 3. Solution structure of NRC.
(A) Cα-traces of 20 models superposed using backbone atoms from residue 12 to 97. (B) Representative ribbon structure, showing substitution sites in N- and C-terminal caps, and position 5 (asn->trp) of the internal (R) repeat in stick representation. The model shown is the closest (in Cartesian space) to the ensemble average. The middle and right views are from the N- and C-termini respectively. (C) Backbone RMSD of the twenty structures in the ensemble. The horizontal line shows the deviation (2.5 Ǻ) selected as a cutoff for structural superposition (panels A, B) and analysis (Table 2). (D) Calculated RDC values (averaged from the final structural models) agree well with measured RDC values. Structures are rendered using PyMOL (DeLano, 2003).

