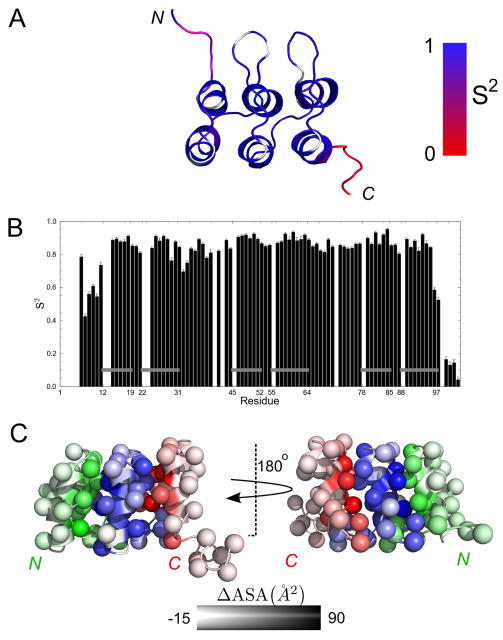
Figure 4. Backbone dynamics of NRC.
(A) Residues in a representative ribbon structure (Figure 3) are coded according to an order parameter S2 (see text and Table S1). White regions correspond to prolyl residues or to residues that could not be assigned to any local model by the modelfree approach (Mandel et al., 1995). (B) S2 values as a function of sequence. Gray horizontal bars correspond to α-helices. (C) Apolar surface area burial upon formation of interfaces between repeats. For clarity, side chains are represented by spheres centered at C®. N-cap, R and C-cap repeats are colored by green, blue and red respectively. Degree of burial is depicted by color intensity. Burial of interfacial surface area is calculated by subtracting the solvent accessible surface area of the NRC NMR structures from N-cap, R, and C-cap fragments (excised from NRC). Values represent the average from all 20 structures in our ensemble.

