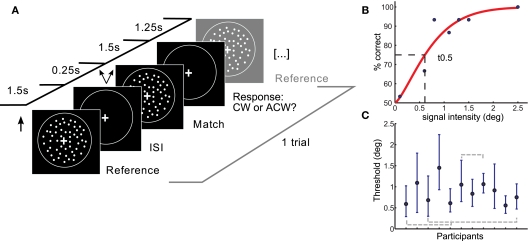
Figure 1.
Setup and results of the psychophysical experiment. (A) A coherent flow field of white dots was moving in an upward vertical direction followed by a match stimulus moving upward with a slight tilt clockwise or anticlockwise from vertical. Participants responded following the match stimulus. One trial is depicted. (B) Psychometric function of one representative subject. Percent correct responses are plotted as a function of the deviation (in degree) of the match stimulus from the reference stimulus. Thresholds were taken at the mid-point of the psychometric function (t0.5, shown by dotted lines). (C) Subjects yielded different thresholds. Shown are individual t0.5 thresholds with errorbars depicting the 95% confidence intervals. Subjects which were not found to be different in a post hoc test are shown with gray dotted lines. deg, degree tilt from vertical; ISI, interstimulus interval; CW, clockwise; ACW, anticlockwise.

