Figure 2.
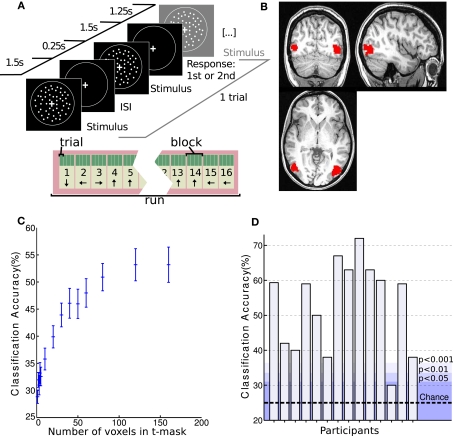
Setup and hMT+ classification results of MR experiment. (A) Experimental setup. Coherent flow fields of white dots moved in one of four directions (0°, 90°, 180°, and 270°, clockwise from upward) while subjects performed a speed discrimination task. One trial is depicted. Blocks consisted of 4 trials and runs of 16 blocks. Direction of motion was consistent within blocks and differed between blocks. (B) Example of an individual hMT+ t-mask as created with the functional localizer experiment. (C) Classification accuracy in hMT+ with varying number of voxels used in the mask. Classification performance averaged over subjects is shown. Note that the accuracy plateaus at 120 voxels. (D) Individual classification accuracy in hMT+ for each subject with a t-mask of 160 voxels. The dotted line indicates chance performance. The shading shows different probability levels as determined by permutation testing.

