Figure 3.
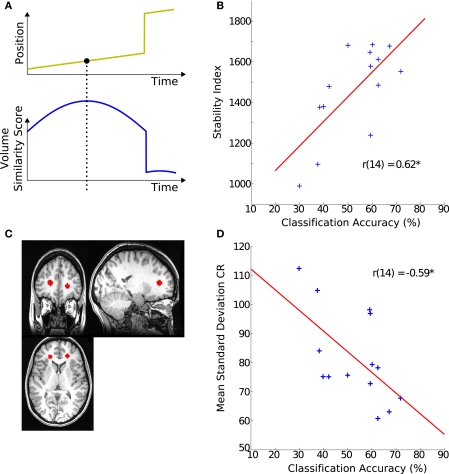
Origins of classification variability. (A) Schematic of the stability index. The upper plot shows simulated movement of a participant across a scanning session. The lower plot indicates how similar each of the volumes is to all the other volumes in the scan. For example the last few volumes are very dissimilar to the rest of the scan. The value of the volume with the highest similarity score is used as this participant's overall stability index. (B) Stability index and hMT+ classification accuracy. The stability index was positively correlated with decoding accuracy. (C) Region of interest in white matter. The region is defined by placing two spheres of 80 voxels each in the anterior portion of the corona radiata (CR). (D) Signal variance in white matter and hMT+ classification accuracy. The individual SD during block-periods in CR was negatively correlated with the decoding accuracy in their hMT+.

