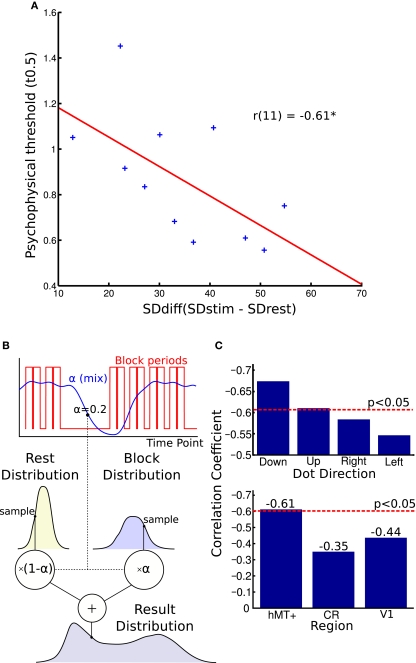
Figure 4.
Blood oxygen level dependent (BOLD) signal variability and behavioral performance. (A) Correlation of BOLD signal variance and direction discrimination threshold. The difference in individual SD between the blocks and rest periods correlated with single-subject thresholds from the psychophysics experiment. A larger variability difference is correlated with lower direction discrimination thresholds. (B) This figure illustrates the generative model used to estimate the parameters of the two distributions. The graph shows how the alpha “mix” values are calculated from the block times. Each volume's alpha value is used to estimate what proportion of the signal is from the stimulus and what proportion is from the rest period. These two distributions are sampled and their weighted sum is found. This is used to generate the distribution. The log likelihood of the real distribution being generated in this way is calculated. The parameters of the block and rest distributions are then altered to maximize this log likelihood. (C) Top graph: Comparing correlations for different stimulus directions. Splitting the block and rest periods in the four directions shown during the MR experiment, we observed small differences in correlation strength. Bottom graph: Comparing correlations over different brain regions. The correlation between noise difference and psychophysical threshold was smaller and not significant in the white matter region CR and V1. CR, corona radiata.

