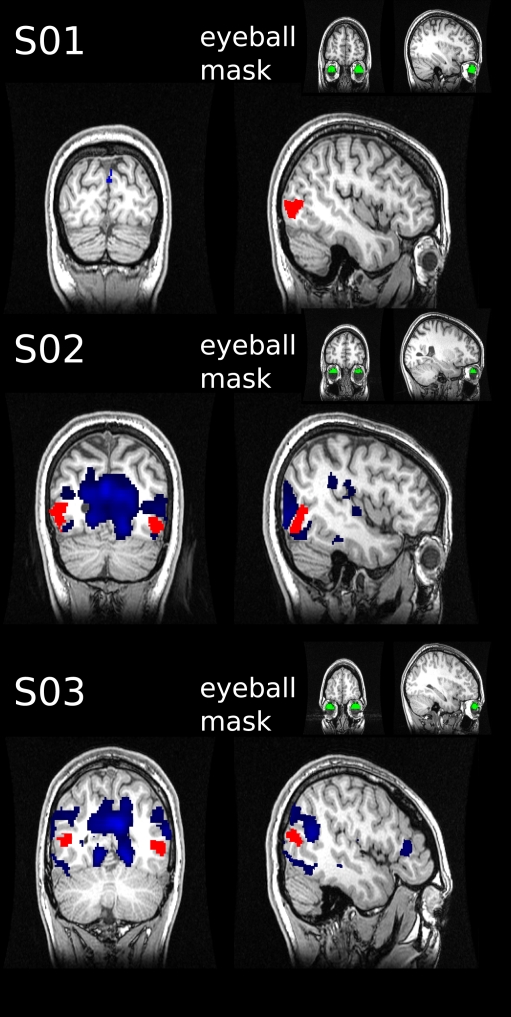
Figure 5.
Retrospective eye movement analysis. The mean timecourse was extracted from the eyeball ROIs (green) defined for three subjects. The timecourses were used as regressors in general linear models to assess correlated activity in the rest of the brain (blue). No overlap was found with the hMT+ masks (red).

