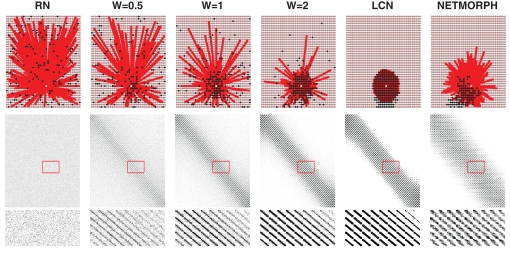
Figure 1.
Upper: Examples of the connectivity patterns. White: target cell, red: cells having output to the target cell, black: cells receiving input from the target cell; Middle: Connectivity matrix. Y-axis: From-neuron index, X-axis: To-neuron index; Lower: Selected part of the connectivity matrix magnified.

