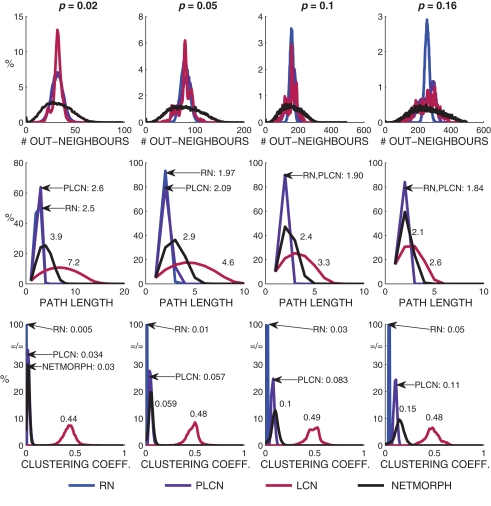
Figure 5.
Out-degree, path length and clustering coefficient distributions plotted for different network classes and different connection probabilities. The power coefficient W = 1 is used for PLCN networks. The mean path lengths and mean clustering coefficients are shown in association with the respective curves.

