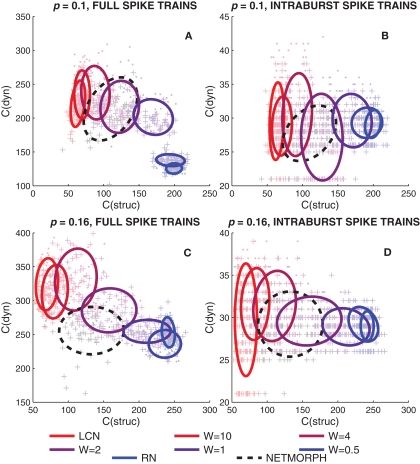
Figure 7.
Kolmogorov complexity approximation of a spike train of a neuron (dyn) versus the KC approximation of the respective row of connectivity matrix (struc). (A,C): The full spike train of a neuron read into the string to be compressed. (B,D): Intraburst segments of the spike train read into separate strings (i.e., several “C(dyn)”-values possible for each “C(struc)”-value). In (A,B) the connection probability of the networks is 0.1, in (B,D) 0.16. The markers “+” represent excitatory neurons, as “·” are inhibitory. The ellipses drawn represent 67% of the probability mass of a Gaussian distribution with the same mean and covariance matrix as the plotted data.

