
Figure 4.
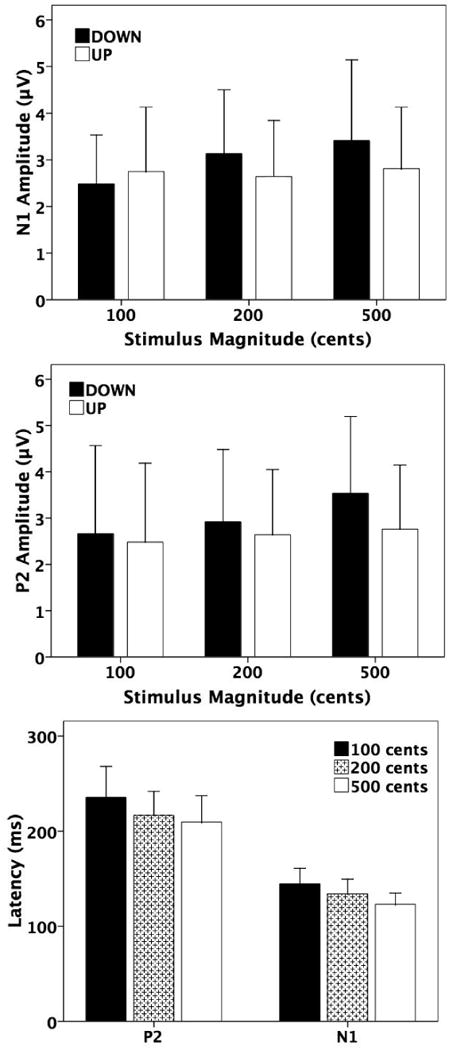
Effects of magnitude and direction of pitch-shift stimuli on the N1-P2 complex. The T-bar plots on the top and in the middle show the N1 and P2 amplitudes as a function of stimulus magnitude and direction. The black and the white T-bars denote the neural responses to downward and upward pitch-shift stimuli. On the bottom, the T-bar plots represent the N1 and P2 latencies as a function of stimulus magnitude, where the black, the sparse dotted, and the white T-bars denote the neural response to 100, 200, and 500 cents pitch-shift stimuli.