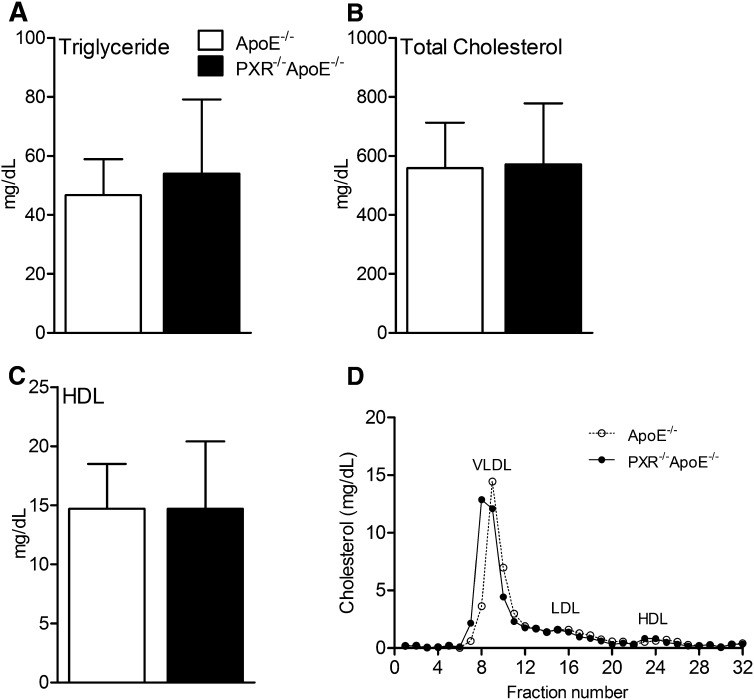
Fig.1.
Plasma lipid profiles of apoE−/− and PXR−/−apoE−/− mice. Four week-old male apoE−/− and PXR−/−apoE−/− mice were fed a semi-synthetic 0.02% cholesterol AIN76a diet for 12 weeks. The plasma triglyceride (A), total cholesterol (B), and HDL cholesterol (C) levels were measured (n = 8–10 mice/group). D: FPLC analysis of plasma cholesterol distribution of apoE−/− and PXR−/−apoE−/− mice. Error bars indicate SD.

