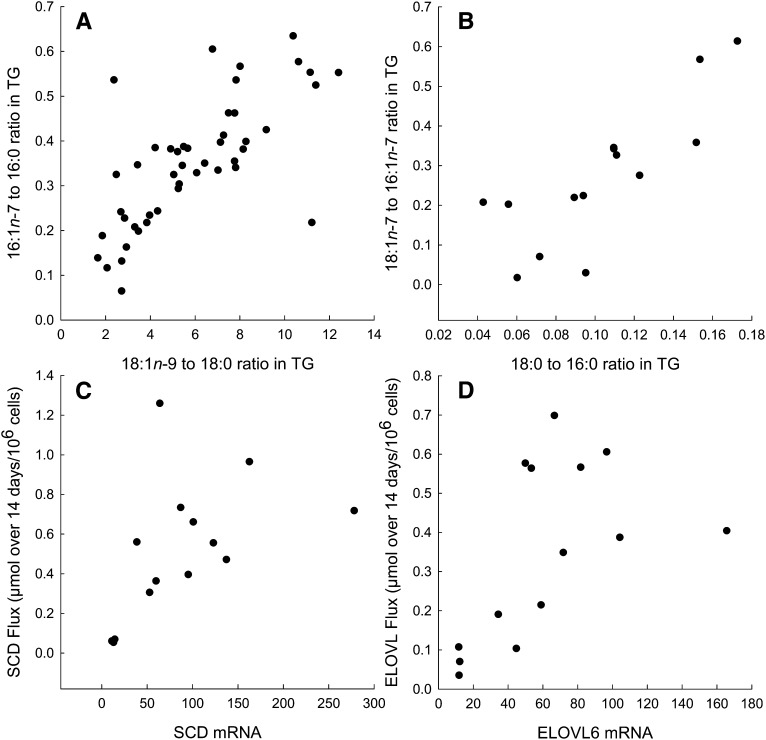
Fig. 4.
Fatty acid ratios in TG and gene expression. A: Relationship between ratios reflecting desaturation; rs = 0.72, P < 0.001. B: Relationship between ratios reflecting elongation; rs = 0.84, P < 0.001. C: Relationship between flux through SCD over 14 days and SCD mRNA; rs = 0.68, P = 0.008. D: Relationship between flux through ELOVL6 over 14 days and ELOVL6 mRNA; rs = 0.67, P = 0.009.

