Fig. 1.
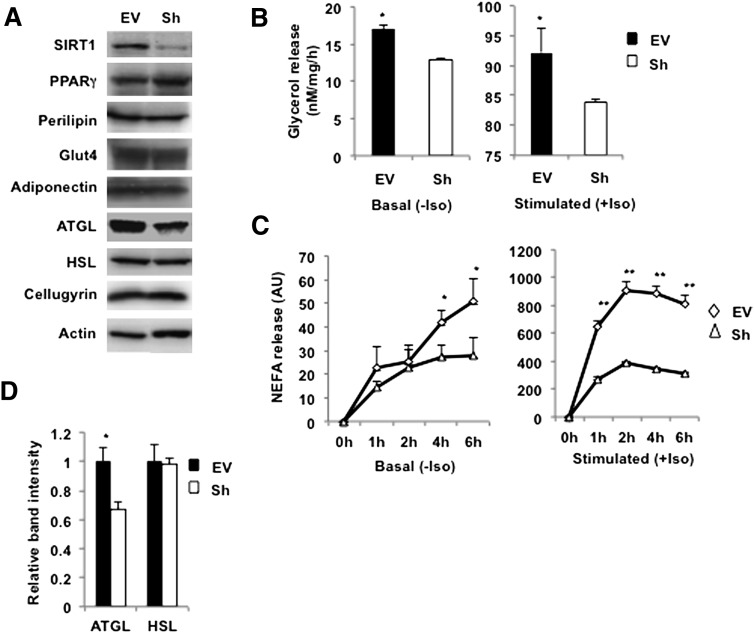
Knockdown of SIRT1 decreases lipolysis and ATGL expression in 3T3-L1 adipocytes. A: Control (EV) and SIRT1-ablated (Sh) 3T3-L1 adipocytes were homogenized on day 10 of differentiation, and total lysates (50 µg) were analyzed by Western blotting for the indicated proteins. Cellugyrin and actin were used as loading controls. B: Empty vector (EV)-infected and stably depleted SIRT1 (Sh) 3T3-L1 adipocytes on day 10 of differentiation were incubated in Phenol Red-free DMEM with 2% FA BSA without (basal) or with (stimulated) 10 μM isoproterenol (Iso) for 1 h. Glycerol was measured in media aliquots in triplicate and normalized by protein concentration in whole-cell lysates. A representative result of three independent experiments is shown. Data are presented as nM glycerol/mg of protein/h and expressed as mean ± SD; * P < 0.05. C: Release of NEFA was measured in triplicate samples from the EV and Sh cells for the indicated time periods and normalized by protein concentration in whole-cell lysates. Data are expressed as mean ± SD; *P < 0.05; ** P < 0.001. D: Relative band intensities for ATGL and HSL in EV (black bars) and Sh (white bars) cells were determined in three independent experiments and normalized by cellugyrin. Data are presented relative to nonstimulated EV cells and are expressed as mean ± SD. * P < 0.05.

