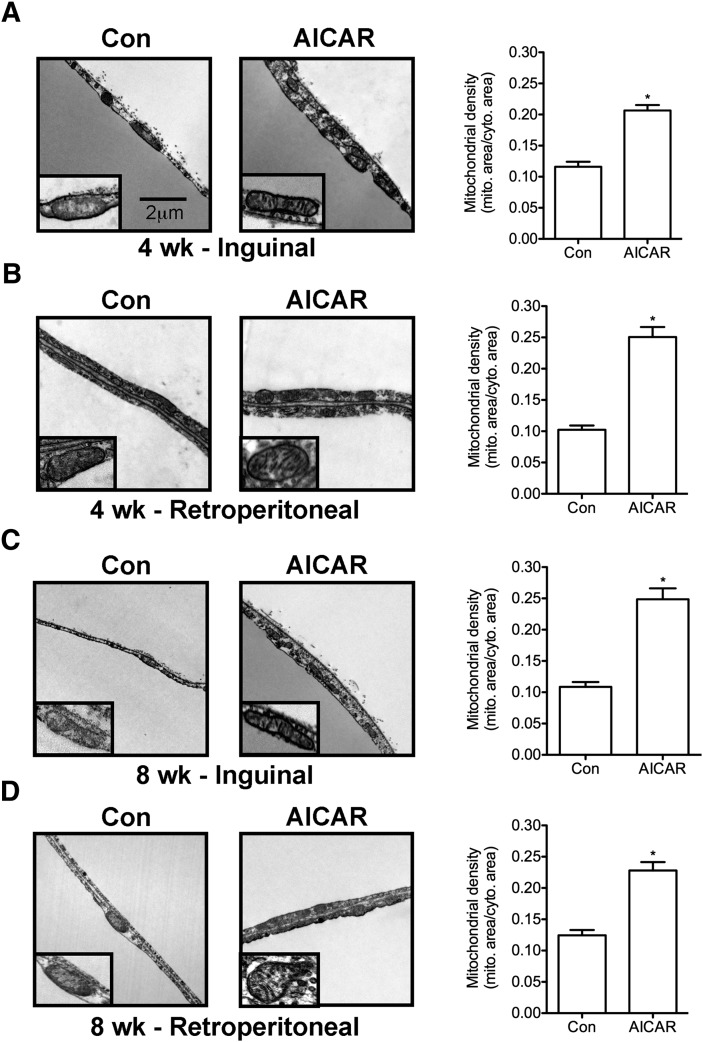
Fig. 3.
Mitochondrial density and morphology in inguinal (A, C) and retroperitoneal (B, D) fat depots at 4 and 8 weeks. Lipid droplet (LD). Arrows point to cristae within mitochondria (inset). All images were taken at 12,500× magnification and insets are magnified. Scale bar represents 2 μm and applies to all panels. N=3 per group. Unpaired t-tests. *P < 0.05 versus control (Con). Data are expressed as mean ± SEM.

