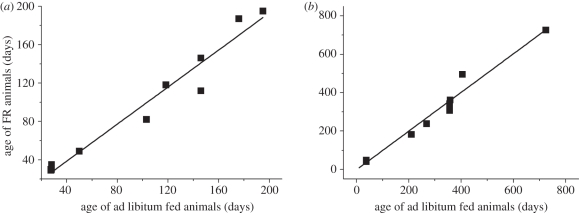
Figure 5.
The age of FR animals against the age of ad libitum counterparts at which they reach to the same percentage of the adult masses, M and MFR. (a) Age at 70% of adult body mass (solid line, y = 0.97x (fixed intercept = 0; r2 = 0.99 95% CI: 0.89, 1.04)); (b) age at 90% of adult body mass (solid line, y = 1.00x (fixed intercept = 0; r2 = 0.99 95% CI: 0.93, 1.08)). The points are derived from empirical studies instead of predictive curves (empirical data are in tables S4 and S5, electronic supplementary material). Where the exact value, i.e. exact 70 or 90% of M or MFR was not available, we used the closest value having error less than 4%. Dashed line, y = 0.97x (fixed intercept = 0; r2 = 0.99% CI: 0.89, 1.04).

