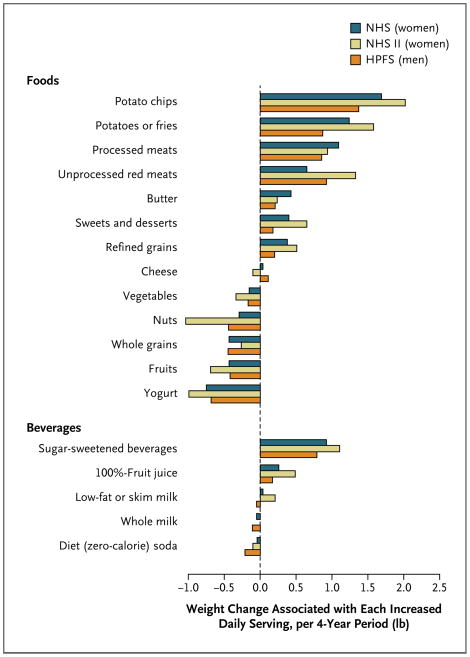
Figure 1. Relationships between Changes in Food and Beverage Consumption and Weight Changes Every 4 Years, According to Study Cohort.
Study participants included 50,422 women in the Nurses’ Health Study (NHS), followed for 20 years (1986 to 2006); 47,898 women in the Nurses’ Health Study II (NHS II), followed for 12 years (1991 to 2003); and 22,557 men in the Health Professionals Follow-up Study (HPFS), followed for 20 years (1986 to 2006). Weight changes are reported for each increase in the daily serving of the food or beverage; decreased intake would be associated with the inverse weight changes. There was little evidence of a significant interaction between diet and physical activity (P>0.10 for the interaction in each cohort). All weight changes were adjusted simultaneously for age, baseline body-mass index, sleep duration, and changes in smoking status, physical activity, television watching, alcohol use, and all of the dietary factors shown. The P value is less than 0.001 for all dietary factors with the exception of butter in the NHS II, cheese in the NHS and NHS II, low-fat or skim milk in the NHS and HPFS, diet soda in the NHS, and whole-fat milk in all three cohorts.

