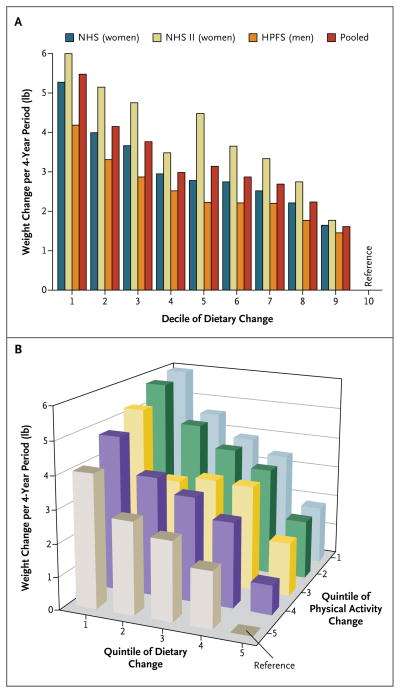
Figure 2. Relationships between Changes in Diet and Physical Activity and Weight Changes within Each 4-Year Period in the Three Cohorts.
In a multivariable-adjusted analysis, overall dietary changes among the 120,877 men and women in the three cohorts were based on the sum of changes in the intake of fruits, vegetables, whole grains, nuts, refined grains, potatoes or french fries, potato chips, butter, yogurt, sugar-sweetened beverages, 100%-fruit juice, sweets and desserts, processed meats, unprocessed red meats, trans fat, fried foods consumed at home, and fried foods consumed away from home. Panel A shows the relationship between deciles of dietary change and weight change per 4-year period in the three cohorts separately and combined. As compared with persons in the top decile, persons in the bottom decile had a 5.48-lb greater weight gain (95% confidence interval [CI], 4.02 to 6.94). Panel B shows the relationship between the cross-stratified quintiles of changes in both dietary habits and physical activity with weight changes per 4-year period for the combined cohorts. As compared with persons in the top quintiles of both dietary change and physical-activity change, persons in the lowest quintiles had a 5.93-lb greater weight gain (95% CI, 4.35 to 7.52). There was little evidence of a significant interaction between diet and physical activity (P>0.10 for the interaction in each cohort). All weight changes were adjusted for age, baseline body-mass index, sleep duration, and changes in smoking status, physical activity, television watching, and alcohol use. P<0.001 for all comparisons.

