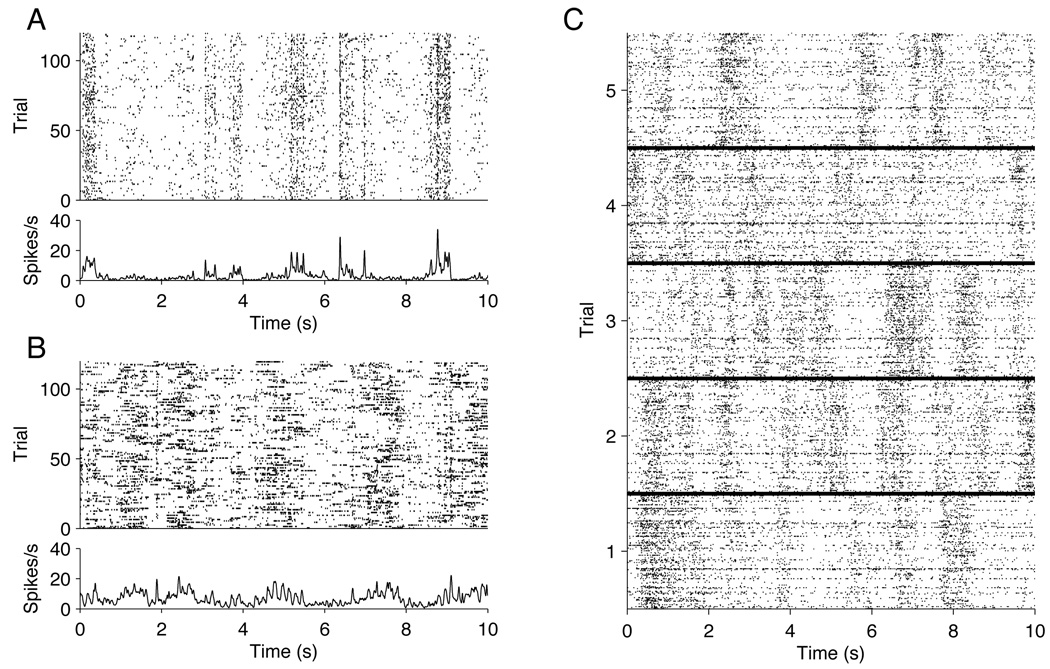
Figure 1.
Neural spike train raster plots for repeated presentations of a drifting sine wave grating stimulus. (A): Single cell responses to 120 repeats of a 10 second movie. At the top is a raster corresponding to the spike times, and below is a peri-stimulus time histogram (PSTH) for the same data. Portions of the stimulus eliciting firing are apparent. (B): The same plots as in (A), for a different cell. (C): Population responses to the same stimulus, for 5 repeats. Each block, corresponding to a single trial, is the population raster for ν = 128 units. On each trial there are several dark bands, which constitute bursts of network activity sometimes called “up states.” Up state epochs vary across trials, indicating they are not locked to the stimulus.

