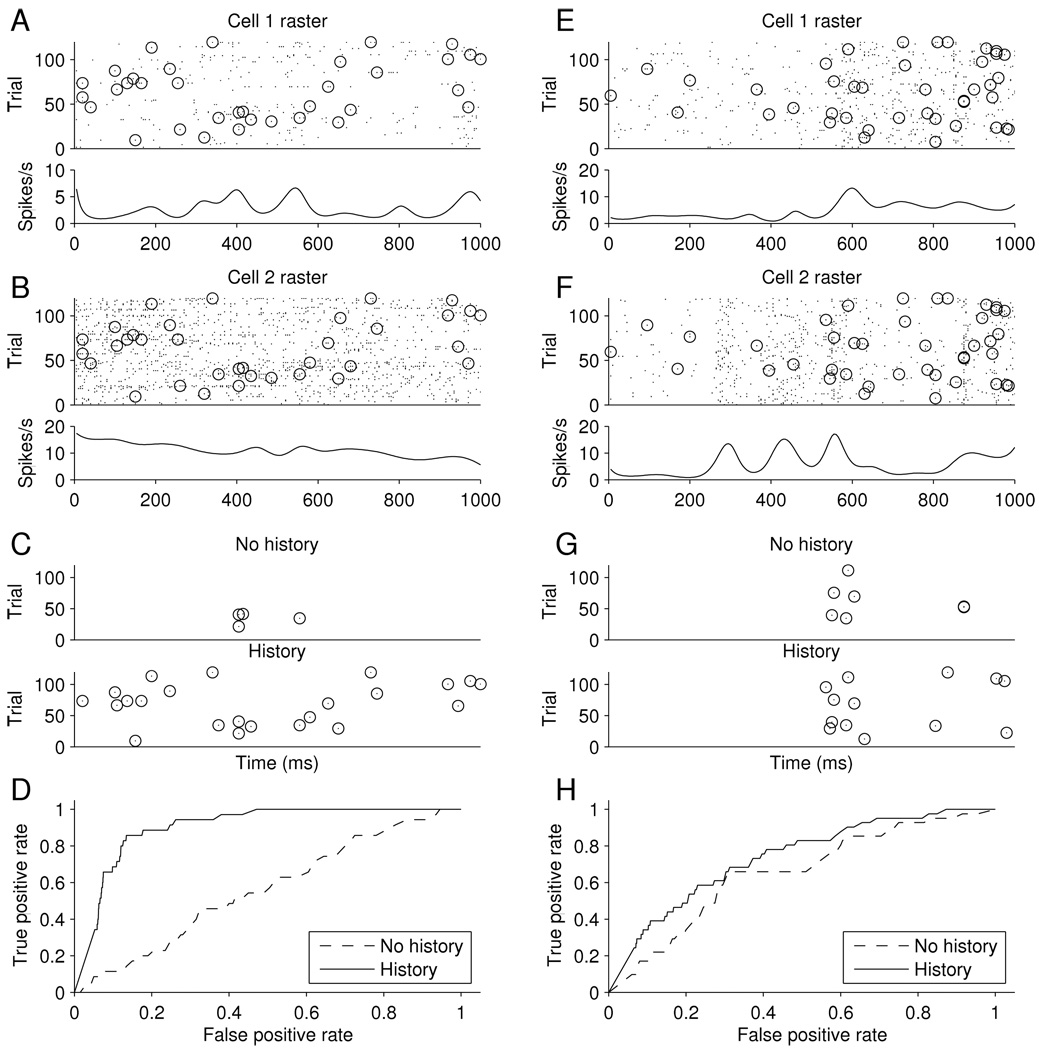
Figure 2.
Synchronous spike analysis for two pairs of neurons. Results for one pair shown on left, in parts (A)–(D) and for the other pair on the right in parts (E)–(H). Part (A): Response of a cell to repetitions of a 1 second drifting grating stimulus. The raster plot is shown above and the smoothed PSTH below. Part (B): Response from a second cell, as in (A). In both (A) and (B), spikes that are synchronous between the pair are circled. Part (C): Correct joint spike predictions from model, shown as circles (as in parts (A) and (B)), when false positive rate is set at 10%. In top plot the joint spikes are from the history-independent model, as in (13), while in the bottom plot they are as in (16), including the network covariate in the history term. Part (D): ROC curves for the models in part (C). Parts (E), (F), (G), and (H) are similar to Parts (A), (B), (C), and (D) but for the second pair of neurons.

