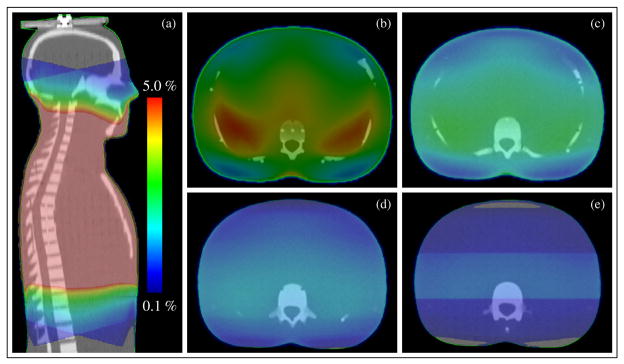
Figure 2.
Out-of-field dose reported by the treatment planning system. Dose scale is set to show 5% to 0.1% of the prescription dose. Dose color wash distributions are shown for (a) sagittal view and axial plane at the center of phantom slices: (b) slice 21, (c) slice 22, (d) slice 23 and (e) slice 24. Note that all dose values above 5% are at the center of the phantom and are shown in dark pink.

