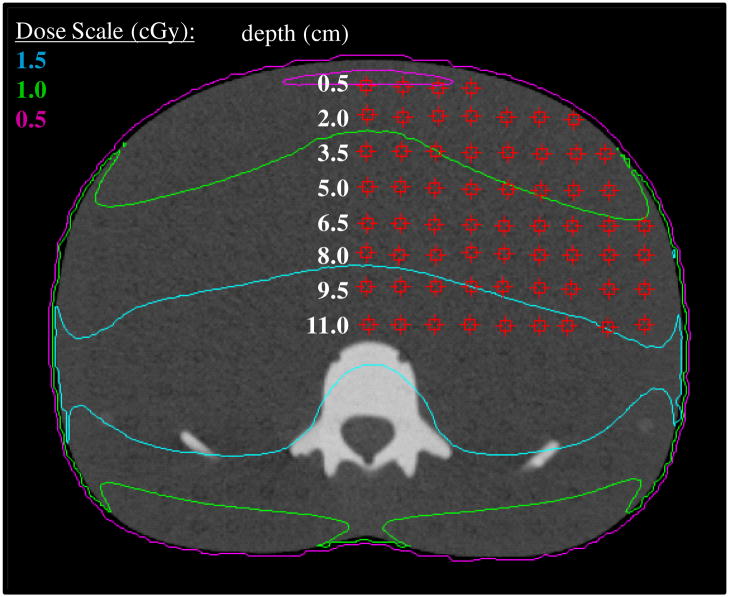
Figure 3.
Axial image for slice 23 of the phantom corresponding to the center of the phantom, with the data point grid shown by red squares. Within the TPS, point doses were determined at each location on the grid using the point dose measurement tool. Each point within the point dose grid corresponds to a single TLD capsule lying at the equivalent position in the phantom.

