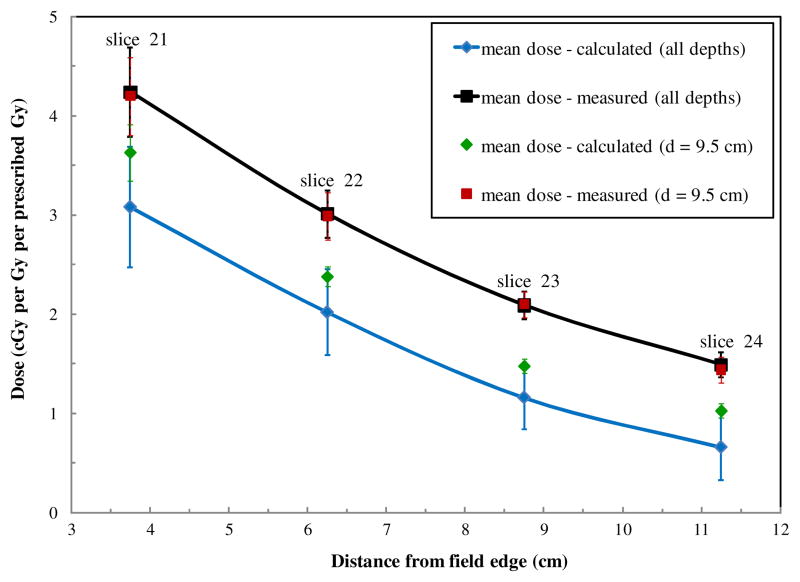
Figure 4.
Plots of mean measured and calculated doses. Mean dose (μ ± σ) was calculated for all TLDs in each phantom slice (corresponding to specific distances from the field edge). Also shown are mean measured and calculated doses along the mid-plane (depth = 9.5 cm) for each phantom slice. The uncertainty bars on each data point represent one standard deviation of the mean. This value is dominated by the spread of doses across each phantom slice as compared to an additional standard uncertainty in each TLD measurement of ≤3%.

