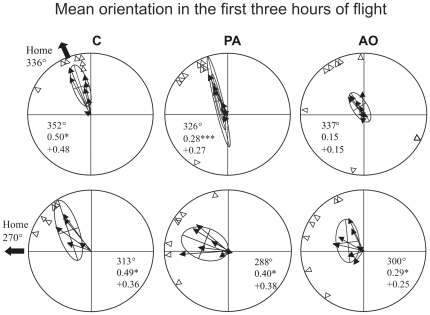
Figure 7. Mean vector distributions relative to the sections of the tracks recorded in the first three hours after release from Bolgheri (home direction 336°) and Montespertoli (home direction 270°), respectively.
Outer arrows: home direction. Inner arrows: individual mean vectors (see Material and methods for further explanations). The open triangles at the periphery of the circle represent the directions of the individual mean vectors. Confidence ellipses of the distributions are reported. The second order mean vector lengths and directions are reported inside the circles. Asterisks indicate the significance level of the one sample Hotelling test: * p<0.05; ** p<0.01; *** p<0.001.

