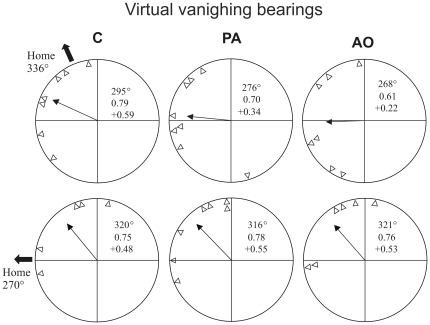
Figure 13. Virtual vanishing bearings. Triangles inside the diagram represent the orientation of each bird at 2 km from the release site.
Outer arrows: home direction. Inner arrows: mean vector of the distribution. Mean vector length and direction, and homeward component are reported (see Results for further explanations).

