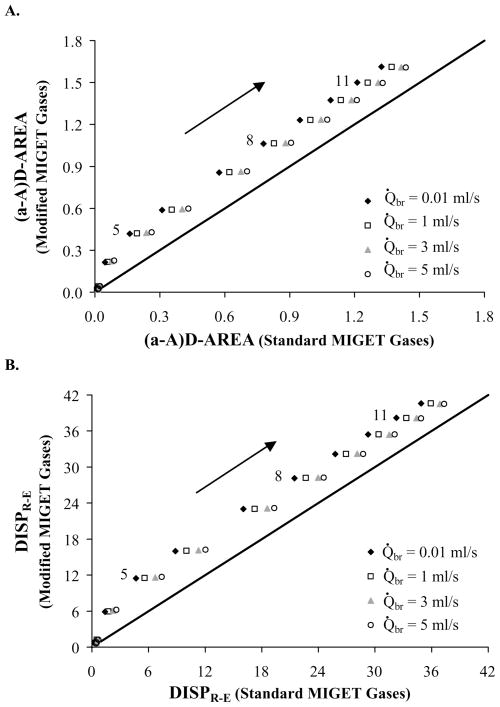
Fig 6.
Statistics calculated from the retention and excretion data. MIGET using modified MIGET gases predicts a greater area under the curve of arterial-alveolar difference, (a-A)D-AREA, (panel A) and a greater dispersion between measured retentions and excretions, DISPR-E, (panel B). The modified MIGET gases recover a larger measure of V̇A/Q̇ heterogeneity. Data labels correspond to conditions (Table 2) and arrows point towards increasing V̇A/Q̇ heterogeneity.

