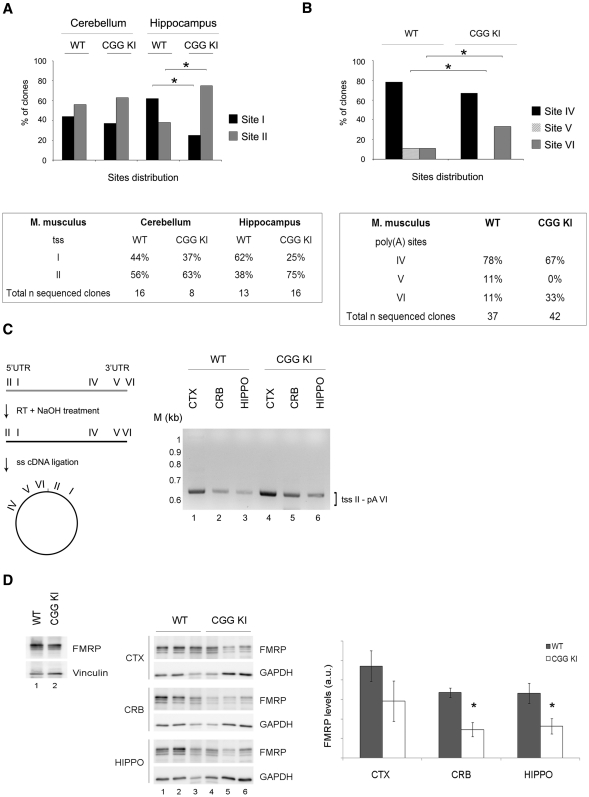
Figure 3.
Brain specific UTRs in a mouse model for the premutation syndromes. (A) Top panel: Histograms showing the distribution of the two tss in the cerebellum and hippocampus from WT and CGG KI mice. χ2 test, *P < 0.05. Bottom panel: percentage of independent sequenced clones for WT and CGG KI mice. (B) Top panel: Histograms showing the distribution of the three poly(A) site usage in total brain from WT and CGG KI mice. χ2 test, *P < 0.05. Bottom panel: percentage of independent sequenced clones for WT and CGG KI mice. (C) Left panel: scheme of the technique used to detect simultaneously the 5′- and 3′-UTRs from single transcript variants. Briefly, the RNA is retrotranscribed, the cDNA is self-ligated and the 3′ and 5′ regions of the circular cDNA amplified by PCR using a forward primer in the 3′-UTR and a reverse primer in the 5′-UTR. Right panel: nested PCR on the circular cDNAs in cortex, cerebellum and hippocampus from WT and CGG KI mice. M, DNA ladder (1 kb). (D) Left panel: FMRP expression in total mouse brain from WT (lane 1) and CGG KI (lane 2). Central panel: FMRP levels in cortex, hippocampus and cerebellum from WT (lanes 1–3) and CGG KI mice (lanes 4–6). Vinculin and GAPDH are used as loading control. Right panel: quantification of FMRP normalized for GAPDH (n = 3, Student's t-test, *P < 0.05).

