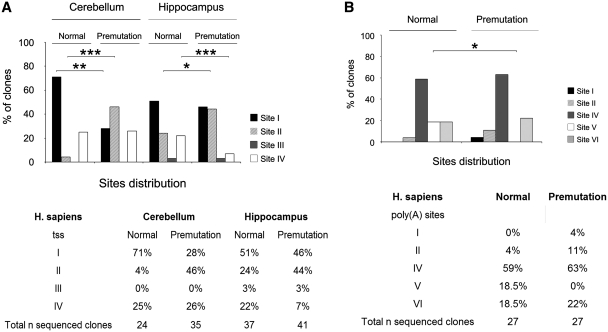
Figure 6.
UTRs detection in the human premutation alleles. (A) Top panel: Histograms showing the distribution of the four tss in normal and premutation alleles in human cerebellum and hippocampus. χ2 test, *P < 0.05, **P < 0.01, ***P < 0.001. Bottom panel: Table showing the number of independent sequenced clones containing the different tss expressed as percentage in the two brain regions analyzed for both normal and premutation alleles. (B) Top panel: Histograms showing the distribution of the five poly(A) sites identified in normal and premutation alleles in human cerebral cortex. χ2 test, *P < 0.05. Bottom panel: The total number of sequenced clones for the normal and premutation allele is expressed as percentage in the five poly(A) sites.

