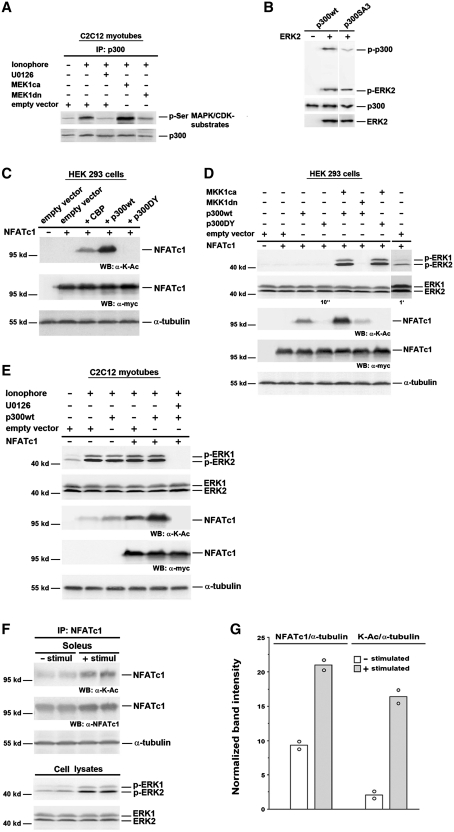
Figure 6.
NFATc1 is acetylated by p300 in a MEK1–ERK1/2-dependent manner. (A) Analysis of p300 phosphorylation by IP and western blot. C2C12 cells were transfected with MEK1ca, or MEK1dn, or empty vector. After 24 h in GM cells were further grown in DM. Two days after transfection cells were pretreated with or without U0126 (10 µM) for 30 min, followed by treatment with Ca2+-ionophore A23187 (0.1 µM) for 3 h. Protein from cell lysates was immunoprecipitated (IP) with anti-p300 antibody. Phosphorylation of p300 was analyzed using an anti-phospho-serine (p-Ser) MAPK/CDK antibody, and p300 protein expression was detected by reprobing with an anti-p300 antibody. (B) In vitro kinase assay with p300wt or p300SA3 incubated with recombinant activated ERK2. The phosphorylation level of p300 was analyzed by western blot using anti-phospho-Ser/Thr-Pro antibodies. The input of proteins was analyzed with anti-p300 and anti-ERK2 antibodies. Analysis of NFATc1 lysine acetylation and ERK1/2 activation in (C) and (D) HEK 293 cells; (E) C2C12 myotubes; and (F) mouse soleus muscle by western blot (WB). In (C–E) HEK 293 or C2C12 cells were transiently transfected with or without NFATc1-c-Myc expression vector alone, or with p300wt, or p300DY, or CBP, or MEK1ca, or MEK1dn, or empty vector. HEK 293 cells were then grown for 2 days in GM, C2C12 cells for 24 h in GM and for 2 days in DM. HDAC inhibitors (300 nM TSA and 5 mM NIA) were added 24 h before lysis in (C) and (D) and to the lysis buffer in (E). C2C12 myotubes were grown in the presence or absence of Ca2+-ionophore (0.1 µM) and/or U0126 (10 µM) for 12 h before lysis. (F) Isolated mouse soleus muscles were electrostimulated (30 min, 15 Hz; + stimul) or not stimulated (− stimul). Eight solei were pooled per each group and proteins were immunoprecipitated (IP) from nuclear extracts with anti-NFATc1 antibodies. Expression of Myc-tagged NFATc1 was monitored by an anti-c-Myc antibody, and NFATc1 lysine acetylation was detected by using an anti acetyl-lysine antibody (K-Ac). Expression of endogenous NFATc1 was analyzed by reprobing with an anti-NFATc1 antibody. Expression of phosphorylated ERK1 and 2 (p-ERK1 and 2) was analyzed using anti-phospho-ERK1/2 antibodies, and expression of total ERK1 and 2 with anti-ERK1/2 antibodies, directly analyzed from cell lysates in (F). Exposure times for enhanced chemiluminescence detection with the LAS-3000 imaging system in (D) were 10 s or 1 min. Detection of α-tubulin served as a loading control. Molecular weights are indicated. (G) Band intensities from western blot analysis as shown in (F) were normalized to α-tubulin and presented as mean of 2 and single values (open circle).

