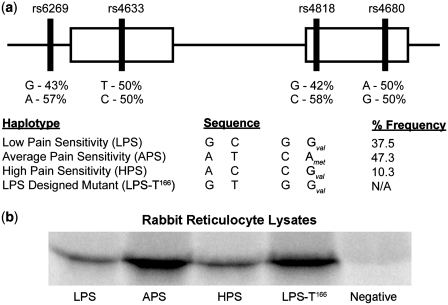
Figure 1.
Haplotypes of COMT and corresponding expression levels. (a) Organization of SNPs for the three haplotypes along COMT gene. Percent frequency of each haplotype from a cohort of 202 healthy Caucasian females is indicated on the right (6). The LPS designed mutant used for later experiments is also included for comparison. (b) In vitro translation in rabbit reticulocyte lysates. Both LPS and HPS share the same expression levels, while APS exhibits higher expression levels. To test whether this is due to the rs4633 SNP near the start codon, we mutated the LPS variant from 166C to 166T. The resultant LPS-T166 mutant displays expression levels on par with APS.

